


ATTENZIONE: I CFD sono strumenti complessi e comportano un rischio elevato di perdere rapidamente denaro a causa della leva. Il 71% dei conti al dettaglio (retail) CFD perde denaro quando fa trading con questo fornitore. Valuta se comprendi a sufficienza il funzionamento dei CFD e se può permettersi di correre l'elevato rischio di perdere il tuo denaro.
Accademia di Trading
A commercial trader can refer to any trader who trades on behalf of a business or institution.
In the commodities market, the Commodity Futures Trading Commission (CFTC) has a special classification for commercial traders and describes them as traders that use the futures market primarily to hedge their business activities.
Hedgers or commercial traders are those who want to protect themselves against unexpected price movements.
Agricultural producers or farmers who want to hedge (minimize) their risk in changing commodity prices are part of this group.
Banks or corporations who are looking to protect themselves against sudden price changes in currencies or other assets are also considered commercial traders.
A key characteristic of hedgers is that they are most bullish at market bottoms and most bearish at market tops.
A non-commercial trader is an individual who has been classified as having no business interest in the futures positions being traded. This means that non-commercial traders are not looking to take delivery or hedge input costs. Instead, non-commercial traders are speculating in the futures market with only a profit motive. The classification of non-commercial traders is used by the Commodity Futures Trading Commission (CFTC) and is based off o CFTC Form 40: Statement of Reporting Trader. The Commitment of Traders report from the CFTC shows the open interest and relative positions of commercial and non-commercial traders.
In contrast to hedgers, who are not interested in making profits from trading activities, speculators are in it for the money and have no interest in owning the underlying asset!
Many speculators are known as hardcore trend followers since they buy when the market is on an uptrend and sell when the market is on a downtrend.
They keep adding to their position until the price movement reverses.
Large speculators are also big players in the futures market since they hold huge accounts.
As a result, their trading activities can cause the market to move dramatically. They usually follow moving averages and hold their positions until the trend changes.
Retail traders typically invest in stocks, bonds, options, and futures, and they have minimal to no access to IPOs. Most trades are made in round lots (100 shares), but retail traders can trade any number of shares at a time.
The cost to make trades typically is higher for retail traders because they have to go through a broker that often charges a flat fee per trade in addition to marketing and distribution costs.
The number of shares traded by retail traders usually is too few to impact the price of the security.
Retail traders are more likely to invest in small cap stocks because they can have lower price points, allowing them to buy many different securities in an adequate number of shares to achieve a diversified portfolio.
Small speculators, on the other hand, own smaller retail accounts. These comprise of hedge funds and individual traders.
They are known to be anti-trend and are usually on the wrong side of the market. Because of that, they are typically less successful than hedgers and commercial traders.
However, when they do follow the trend, they tend to be highly concentrated at market tops or bottoms.
Like so many other indicators, the Commitment of Traders Report can, in fact, be used as a tool to trade if we fully understand – and read correctly – where volumes of the market are and where the different positions of the different types of investors that characterize this report are.
Having understood that this report allows us to identify three main types of traders –hedgers, large and small investors – we can use it in our trading in two particular occasions:
Reversals (Type One) – When the spread between commercial hedgers and large investors is big, then we should expect a market reversal.
This can easily be explained by understanding that large investors are normally accumulating their positions around key reversal points. When this happens this in and off itself is a sign of a potential reversal. If the spread between the Large Investors and Hedgers is high, and it reaches a peak, then it means that we are in a tipping point towards a potential reversal that we can catch in its infancy.

Reversal (Type Two) – A subtle trading strategy looks at the importance of large traders in determining where the market will go next. When large traders start to reverse their positions (i.e. the large investors line’s trend starts reversing), we can expect a market reversal most of the times.
Finally, what can we expect from this indicator? While it’s very useful to spot trends reversals, the COT report does not provide a holy grail to trading. First, this information is more relevant for long-term trades; second, it needs to be complemented by other information and knowledge of other forces that move the market.
As you would’ve guessed, ideal places to go long and short are those times when sentiment is at an extreme.
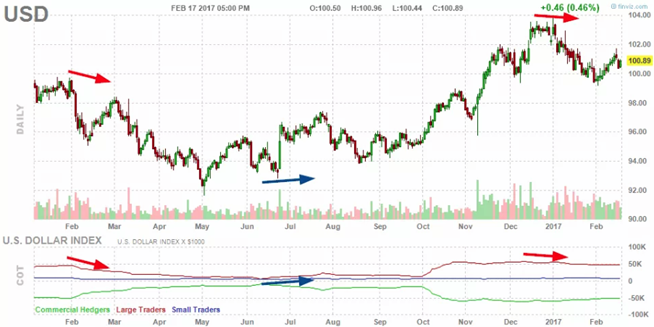
If you noticed from the previous example, the speculators (green line) and commercials (blue line) gave opposite signals.
While hedgers buy when the market is bottoming, speculators sell as the price moves down.
Here’s that COT report chart again:
Hedgers are bearish when the market moves to the top while speculators are bullish when the price is climbing.
As a result, speculative positioning indicates trend direction while commercial positioning could signal reversals.
If hedgers keep increasing their long positions while speculators increase their short positions, a market bottom could be in sight.
If hedgers keep adding more short positions while speculators keep adding more long positions, a market top could occur.
We could say that speculators, because they follow the trend, catch most of the move BUT are wrong on turning points.
Commercial traders, on the other hand, miss most of the trend EXCEPT when price reverses.
Until a sentiment extreme occurs, it would be best to go with the speculators.
The basic rule is this: every market top or bottom is accompanied by a sentiment extreme, but not every sentiment extreme results in a market top or bottom.
Using the COT report can be quite useful as a tool for spotting potential reversals in the market.
Determining extremes can be difficult because the net long and short positions are not all relevant.
What may have been an extreme level five years ago may no longer be an extreme level this year.
What you want to do is create an index that will help you gauge whether the markets are at extreme levels.
In order to create your indicator, you need to settle with two points: you need to decide how long a period you want to cover [here the more values you put into the index, the less sentiment extreme signals you are going to receive, but the more reliable they will be and vice versa].
And you also need to calculate the difference between the positions of large speculators and commercial traders for each week of trading period of your choosing.
And here is the equation: difference = net position of large speculators – net position of commercials.
As a result of the equation you are going to get a lot of numbers. Some of them are going to be negative, some are going to be positive. After you calculated all of them, you are going to have to rank them with 100 being the largest position and 0 being the smallest position.
From here on you have your own COT report indicator. And it is going to act just like RSI or stochastic: the closer the chart to one of the extremes – 0 or 100 – the more likely it is that we are going to see a reversal of the existing trend.
Take note that if large speculators are extremely long, this would imply that commercial traders are extremely short.
This would result in a positive figure.
On the other hand, if large speculators are extremely short, that would mean that commercial traders are most likely extremely long. this would result in a negative figure.
This would result in a negative figure.
1. Rank these results in ascending order, from most negative to most positive.
2. Assign a value of 100 to the largest number and 0 to the smallest figure.
Once we have assigned values to each of the calculated differences, we should be alerted whenever new data inputted into the index shows an extreme: 0 or 100.
This would indicate that the difference between the positions of the two groups is largest and that a reversal may be imminent.
If the COT report reveals that the markets are at extreme levels, it would help pinpoint those tops and bottoms.
You can download the COT indicator if you’re trading on an MT4 platform and you can find the link in our COT data to indicator forum thread!
Calculating the percentage of speculative positions that are long or short would be a better gauge to see whether the market is topping or bottoming out.
The equation to calculate for the %-long and %-short is indicated below:

*The information presented above is intended for informative and educational purposes, should not be considered as investment advice, or an offer or solicitation for a transaction in any financial instrument and thus should not be treated as such. Past performance is not a reliable indicator of future results.

Online Chat Chat with us
E-mail:supportsohomarkets.eu
Copyright © 2024 - Tutti i diritti riservati.
SohoMarkets (Cipro) è una denominazione commerciale di Vstar & Soho Markets Ltd, una Società di investimento di Cipro (Cyprus Investment Firm - CIF) autorizzata dalla Commissione per i titoli e la borsa di Cipro (Cyprus Securities and Exchange Commission - CySEC) con licenza n. 409/22.
Limitazioni regionali: Vstar & Soho Markets Ltd. offre i propri servizi ai residenti dello Spazio Economico Europeo (ad esclusione del Belgio), Svizzera, India, Indonesia, Malesia, Filippine e della Vietnam.
ACCORDO CON IL CLIENTE (TERMINI E CONDIZIONI) INFORMATIVA SULLA CATEGORIZZAZIONE DEI CLIENTI Informativa sui reclami Informativa sui conflitti d'interesse Informativa sui cookie Fondo di compensazione degli investitori Documento contenente le informazioni chiave (KID) - CFD su COMMODITY Documento contenente le informazioni chiave (KID) - CFD su CRIPTOVALUTE Documento contenente le informazioni chiave (KID) - CFD su VALUTE FX Documento contenente le informazioni chiave (KID) - CFD INDICI Documento informativo chiave (KID) - CFD su ENERGIA Documento contenente le informazioni chiave (KID) - CFD su METALLI Documento contenente le informazioni chiave (KID) - CFD su AZIONI Informativa sull'esecuzione degli ordini Informativa sulla privacy Informativa sul rischio Dichiarazione di sintesi sulla qualità dell'esecuzione 2022 Rapporto sulla divulgazione e la disciplina del mercato 2022